
Y. Y. Scott Yiu, PhD
Data scientist
Ex-Postdoc and PhD graduate of the University of Cambridge

Basics
What is the El Niño Southern Oscillation? Why is it interesting? Why does it affect soy bean prices?
Mark Twain around 1880 famously remarked "The coldest winter I ever experienced was a summer in San Francisco." He probably referred to climate effects that resulted from a strong El Niño Southern Oscillation (ENSO) event at around that time. Such events have been known to exist for a very long time. One of the first scientific mentions goes back to Señor Federico Alfonso Pezet in 1895, see Philander 1989.
ENSO is a irregular inter-annual cycle where the winds and sea surface temperatures changes in the tropical Pacific (Met office site). There are two phases to ENSO: a warm phase (El Niño) and a cold phase (La Niña). Normally, there is a sustained surface Easterly wind from the walker circulation (Easterly means wind from the East) , see Figure 1. This pushes the warm surface water to the West allowing cold deep water to upwell in the East. Thus a temperature and pressure gradient is formed between the Eastern and Western Pacific. During El Niño, the walker circulation breaks down. The surface Easterly wind slows or even reverses direction. The warm water can then extend back towards the East. This causes adnormally warm water in the Central and Eastern Pacific, see Figure 2. La Niña is just a intensification of the normal circumstances where the walker cell and the surface Easterly winds becomes stronger than normal.

Figure 1: This figure shows the Walker circulation in the tropical Pacific and how it impacts the ocean thermocline. The sustained Easterly winds from the Walker cell pushes the warm water to the West allowing deep cold water to upwell in the East. Figure by PAR (public domain figure)


Figure 2: Top panel shows the circulation in normal conditions. Bottom panel shows the circulation under El Niño conditions. During El Niño, we can see the walker circulation breaking down, the thermocline gradient falling and a SST `warm tongue' stretching towards the East. Figure taken from Wikipedia (public domain figure), which is in turn derived from NOAA figures.
We usually measure the magnitude of ENSO events by using the Southern Oscillation index (SOI) or Oceanic Niño index (ONI). The SOI measure the pressure difference between the East and the West (Tahiti and Darwin, Australia), see Figure 3. A positive (negative) SOI indicates a La Niña (El Niño). For details of the calculations, see the SOI NOAA article. The ONI uses SST in the Niño 3.4 region. Approximately, if the Niño 3.4 region SST anomaly is greater than 0.5C, it is an El Niño. If the Niño 3.4 region SST anomaly is lower than -0.5C, it is an La Niña, see Figure 4 for the location of the Nino3.4 region. Details of the calculations can be found in ONI NOAA article. These are the two most common indicies but there are many more used scientifically.


Figure 3: Left panel shows location of Darwin, Australia. Right panel shows location of Tahiti. Figure taken from Google maps.

Figure 4: This figure shows the locations of the Niño 3.4 region. A region commonly used to calculate the magntude of ENSO events. Figure taken from NOAA.
ENSO does not only affect the tropical Pacific region. The climate effects of ENSO reaches globally. These climate effects between two geographically distinct places are called teleconnections. ENSO teleconnections can cause many places to have abnormal weather patterns. These may include precipitation and temperatures. Figure 5 shows the typical changes of precipitation during El Niño and La Niña. These changes are not only important climatologically but also social-economically. During strong El Niño episodes, many countries have increased amounts of disasters due to loss of crops, flooding and diseases. For example, the great famine in 1876-1879 (which killed over 13 million people in China) has been linked to ENSO events. Therefore it is very important for us to have a good understanding of these teleconnection.
As discussed previously, ENSO events can have a direct and significant impact to crops around the world. However, there are also other indirect effects of ENSO events. One such example is the link between ENSO and soy bean prices: fishes caught in the eastern Pacific are often used as a ingredient for fishmeal. However, during strong El Nino episodes, the amount of fish caught in the eastern Pacific will fall (due to the rising sea surface temperature). This will often lead to soy beans, a fishmeal alternative, to have rising prices.


Figure 5: This shows the typical precipitation changes during El Niño (top panel) and La Niña (bottom panel). Figures taken from Columbia University.
What and where is the Amundsen sea low? Why is Antarctic sea ice increasing in today's warming climate?
The Amundsen sea low (ASL) is a quasi stationary low pressure system that can be found approximately in the Amundsen-Bellingshausen-Ross sea, see Figure 6.

Figure 6: Locations of the seas in Antarctica. The ASL is approximately located somewhere (it varies) in the Bellingshausen, Amundsen and Ross sea. Figure by Nickpo (public domain figure)
The ASL can be seen if we look at the time-meaned sea level pressure (SLP). It is formed as low pressure systems form, propagate and then dissipates as they move through this area. This can be seen in the animated movie in Figure 7.

Figure 7: Low pressure systems are forming, propagating and then dissipating as they move through the Amundsen Sea region. By taking the time-mean of the SLP, we will be able to observe the ASL. Figure by Scott Yiu
It turns out that Antarctic sea ice is slightly increasing in today's warming climate. This is very different to Arctic sea ice which is diminishing rapidly compared to pre-industrial era ice. Figure 8 and 9 shows the Antarctic sea ice and Arctic sea ice trends respectively.

Figure 8: Maximum sea ice extend in Antarctica. Shows approximately an increase of 1.5% a year. Figure by NASA (public domain figure)

Figure 9: Arctic sea ice extent anomaly. Shows a marked decreased in 2015 compared with 1955. Figure by NASA (public domain figure)
Currently, we do not fully understand the reason for the increasing Arctic sea ice. One possible explanation given is due to the variability of sea ice. Another possible explanation is due to the changing strength of the ASL as climate change occurs. The sea ice in the Amundsen-Bellingshausen-Ross sea is more kinetically driven rather than thermodynamically driven. Thus if the ASL changes strength or location, it may advect the sea ice differently. This may play a significant role in the sea ice near Western Antarctica.
What does ENSO do to the Amundsen sea low? Does it change by season?
There are many ENSO teleconnections. One such teleconnection is its effect on the ASL. During El Niño (La Niña), there is a weakening of the ASL (This is characterised by a increase in pressure of the low pressure system). Figure 10 shows the SLP anomaly in the Amundsen Sea region during La Niña and El Niño events.
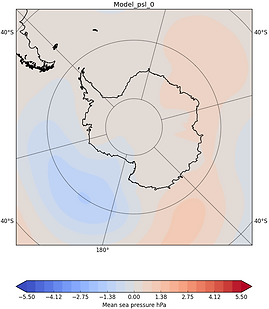

Figure 10: This figure shows the mean sea level pressure anomaly for extreme La Niña (-3.0K in Niño 3.4 region) in the left panel and extreme El Niño (+3.0K in Niño 3.4 region) in the right panel. We can clearly see the negative anomaly for the La Niña is not at the same positon, magnitude or structure of the El Niño.
The teleconnection to the Amundsen Sea low is also season dependent. It is strongest in June-July-August (JJA) while weakest in December-January-February (DJF). This seems counter intuitive at first as ENSO events tend to peak in DJF and is weak in JJA. For more details, please see my research.