
Y. Y. Scott Yiu, PhD
Data scientist
Ex-Postdoc and PhD graduate of the University of Cambridge

Research
Using machine learning to make skillful predictions of the winter time North Atlantic Oscillation
(Papers submitted to ASL)
The NAO is the leading mode of variability in the North Atlantic region, and plays an important role in determining wintertime climate in both Europe and North America (e.g. Hurrell, 1995; Hurrell and van Loon, 1997; Rodo et al., 1997; Wibig, 1999; Scaife and Folland, 2008). Through changes to wintertime temperatures and rainfall in these regions the NAO has financial, ecological and human health impacts (e.g. Kim and McCarl, 2005; McGregor, 2005; Stige et al., 2006; Jerez et al., 2013; Palin et al., 2016; Svensson et al., 2015).
We mainly test two statistical methods for predicting the winter time (DJF) NAO: Ridge regression, a ML technique, and multiple linear regression (LR). Both methods use a number of predictors, weighted by coefficients, to predict a single timeseries (i.e. the NAO index). However, while LR requires predefined predictor indices, ML approaches are not bound by preconceptions on what data is important, and entire datasets can be used. As a result, ML can potentially allow for the identification of previously unknown sources of predictability within the Earth system.
The figure below shows the predicted NAO index obtained from both the ML and LR techniques (red and blue lines, respectively), alongside the observed wintertime NAO index (dark grey). For the full record (1979-2017), ML produces more skillful predictions of the NAO compared to LR, with correlation coefficients of r=0.61 and r=0.50 respectively. However, it should be noted that the correlation coefficients obtained with both methods are sensitive to the number of years used. Using data from 1979 and running to different end dates between 2007 and 2017, correlation coefficients varying between 0.43-0.61 for ML and 0.39-0.57 for LR are obtained. Results for the LR model are consistent with those of Dunestone et al (2016) if the same time period is considered (for 1981-2015, LR=0.57 c.f. 0.60). We attribute any minor differences to the different dataset used.
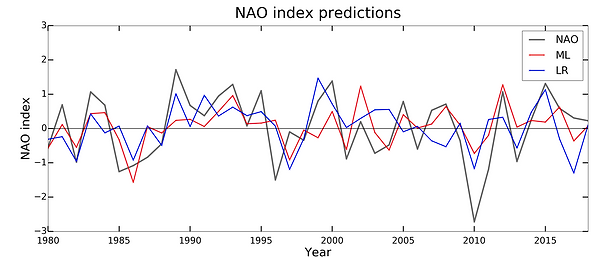
Figure shows the NAO index of ERA--interim reanalysis (black), machine learning (red) and linear regression (blue).
We find the machine learning technique Ridge regression is a promising alternative technique for making seasonal forecasts of the wintertime NAO and identifying the sources of this predictability and for. We are now trying to improve the model by replacing the linear methods with non-linear convolution neural networks.
The seasonality and mechanism of ENSO teleconnections to the Amundsen Sea region
(Paper published in JCLIM: https://doi.org/10.1175/JCLI-D-18-0813.1)
We know that the El Niño Southern Oscillation (ENSO) peaks in December--January--February (DJF) but the teleconnection effect in the Amundsen Sea is the strongest in June--July--Auguest (JJA). In order to understand this, we need to first understand the mechanism of the teleconnection in detail. Previous studies has suggested that the ENSO teleconnection to Antarctica is via modulation of the Pacific-South America pattern (PSA). This is a a positive--negative--positive pressure wavetrain to runs from the tropics to the Amundsen Sea region (and onwards to the Weddell Sea), see Schneider et al 2006. Previous studies has also hypothesised that the teleconnections is due to Rossby wave generation and propagation, see Lanchlan-Cope et al 2006. However, most studies have only analysed a small amount of years (or even individual years) due to the lack of observations -- this makes it difficult to make any statistically significant statements in this area of high variability. Moreover, many previous studies do not use Rossby wave methods but rely on the geopotential height as an proxy.
We follow the methods of Li et al 2014 which applies Rossby wave methods to analyse the teleconnections from the atlantic. We found that due to differences in the jet positions between summer and winter, the Rossby wave source only appears in JJA. Furthermore, in DJF, the atmosphere does not allow propagation of the Rossby waves into the Amundsen Sea low area. Therefore, this explains the seasonality difference in the teleconnection.


This figure shows the Rossby wave source anomaly in extreme El Niño (+3.0K Niño 3.4) for DJF (top panel) and JJA (bottom panel). We can clearly see a strong Rossby wave source in JJA but not in DJF
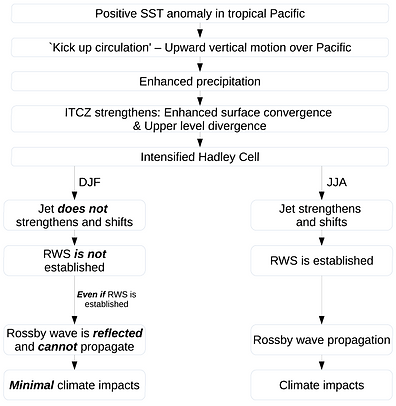
A flowchart summarising the differences in the teleconnection between DJF and JJA. Inspired by Simpkins et al 2014.
The linearity of ENSO and the teleconnection to the Amundsen Sea region
(Paper submitted to QJRMS)
The linearity of ENSO has been explored by many previous studies. However, the linearity of the ENSO teleconnection has been scarcely explored. Many previous studies look at the composite or linear regression of these teleconnections. While this is correct to first order and is the simplest way to understand these teleconnections. These methods may be slightly misleading. We found that the changes due to a La Niña are significantly different to changes caused by a El Niño. In certain circumstances, the non-linearity may not only be the magnitude of the anomaly but also the sign of the anomaly.
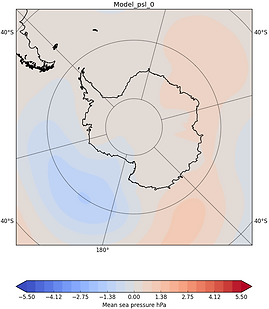

This figure shows the mean sea level pressure anomaly for extreme La Niña (-3.0K in Niño 3.4 region) in the left panel and extreme El Niño (+3.0K in Niño 3.4 region) in the right panel. We can clearly see the negative anomaly for the La Niña is not at the same positon, magnitude or structure of the El Niño.
On the linearity of the stratospheric and Euro-Atlantic sector response to ENSO
(Coauthor on paper published to JCLIM: https://doi.org/10.1175/JCLI-D-18-0746.1)
El Niño Southern Oscillation (ENSO) influences climate variability in the Euro-Atlantic region. In this study, we investigate the dependence of the winter Euro-Atlantic climate response on ENSO amplitude using climate model experiments with idealised sea surface temperature perturbations corresponding to Niño 3.4 index anomalies of ±3, 2.25, 1.5 and 0.75K. In the North Pacific, El Niño (EN) deepens and shifts the Aleutian low eastward, while the equivalent magnitude La Niña (LN) perturbations drive opposite sign and fourfold weaker anomalies. The EN perturbations weaken the Northern hemisphere stratospheric polar vortex, causing a decrease in zonal mean zonal wind at 60°N and 10 hPa that increases approximately linearly with EN magnitude.